If you've ever looked at a hi-fi component stereo system you've probably seen a graphic equalizer. Traditional analog ones look like this one sold by Crutchfield:
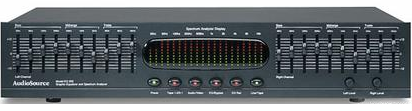
Each slider lets you raise or lower the volume of certain sounds in your music. If you know that a flute is in a frequency range of 250 Hz - 2500 Hz, you could make the flute part louder by raising the sliders that corresponded to that range. (As you see from this acoustics chart, frequency ranges for instruments do overlap--so raising a flute can possibly also affect other things like Oboes or vocals.)
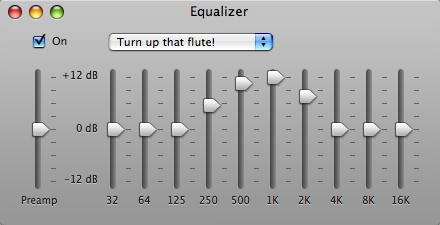
Cheaper stereo systems usually only offer "bass" and "treble" knobs. Yet nearly every MP3 player has a digital EQ. Even iTunes has one, if you click Show Equalizer on the View menu:
But here's a problem: because graphic equalizers break your signals into pieces and then put them together again, they introduce some distortion. There's a simple way to get a sense that this distortion exists: you can set all the sliders to "flat"... run the equalizer algorithm... and see that you don't get the same data out that you put in.
As a student back in 1996, I came up with a way you can design a digital graphic equalizer so the algorithm will (nearly) exactly output the original signal when sliders are flat, even after running your audio through a barrage of filtering mathematics. Practically speaking, you would want to bypass the equalizer in that case for performance reasons. Yet there is an alluring elegance to an approach which would converge upon the original signal if you applied it with flat levels... and it strongly suggests you'd have overall less distortion when the sliders weren't at zero. (This turns out to be true!)
I employ only two digital filters: a specially matched highpass and lowpass. Recursively applying these filters on downsampled versions of the data creates the exact logarithmic bands that are found in graphic equalizers. The process additionally leads to a phenomenon known as "perfect reconstruction". I explain the details below.
How do other equalizers work?
There are many different ways you might choose to implement a graphic equalizer. Here's a brief survey of methods I'm aware of:
- Frequency Sampling: A graphic equalizer can be seen as a simple digital filter which is redesigned each time the equalization settings change. When looked at this way, the obvious method for creating a graphic equalizer is to incorporate a filter design routine into your digital device, and change the desired frequency response Hd(ω) according to the equalization levels. Since frequency sampling design is as simple as an inverse discrete fourier transform (IDFT) of the desired filter curve, it is entirely possible to implement this on inexpensive hardware.The advantage to this approach is that it is relatively easy to understand and implement. Only one filter is required at any given time, so it uses memory effectively. Unfortunately, since a complex filter design algorithm is not feasible on inexpensive hardware, there will undoubtedly be ripple and Gibbs phenomena from the IDFT. Reducing this ripple will require filters of somewhat extreme length. More importantly, because the low frequency bands have so few points relative to the high frequency bands, the response in these regions will always be relatively poorer.
- Filter Banks: Equalization using filter banks means that you would design a high quality band-pass filter for each frequency range, then run the data through each filter in parallel and take the weighted sum of the outputs to form your final signal. The weights used in the sum would be derived from the equalization settings. This method is directly related to analog graphic equalizers, where a potentiometer is used to change the contribution of a different band-pass filter for each band.This approach could quite possibly achieve a better response than the frequency sampling technique. Because the band-pass filters are designed in advance, they could be made using a more sophisticated algorithm than the IDFT. Also, no run-time filter redesign process is needed, thus simplifying the DSP routine. However, since all the filters would still be the same length, the fundamental problem would remain of the low frequency bands being more poorly filtered than the high frequency bands. In addition, if you are going to have N levels of equalization, this technique will need to apply N filters and hence need N times the number of mathematical operations that the single-filter frequency sampling technique required!
- Algorithmic Modification: Rather than applying several different filters to the data and then constructing a weighted sum from the outputs, it may be possible to determine the relationship between an equalization slider value and the impulse response of the filter to be designed. This way, whenever a user modifies an equalization level, the impulse response of the filter can be affected in a predetermined way for that modification. One can imagine the impulse response starting out as a unit impulse when the equalization levels are flat, and adjustments to the equalization levels causing the filter’s impulse response to undergo mathematical corrections.This approach could achieve much the same result as the filter bank example, except that it would only generate a single filter (as in the frequency sampling case). Additionally, the frequency response could be perfectly flat if all the equalization levels were flat. The biggest disadvantage of this approach is the complexity involved in figuring out if such an algorithm exists, and if so...exactly what it is.
My Downsampling Approach to Graphic Equalization
The method I came up with involves using only two pre-created filters to provide any number of equalization levels. The signal is recursively split into its high half and low half of the frequency spectrum--and the low half is then downsampled to pull down the band edge to half the former Nyquist rate. Then the high half is weighted according to the appropriate equalization setting and added into the total result. I've drawn out this procedure in the figure below (Eq1..EqN represent multiplication by the weightings of the frequency bands from the graphic equalization levels.):
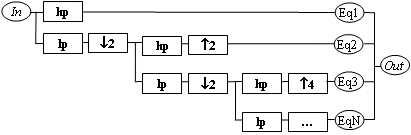
The recursive binary division of the low half of the frequency spectrum results in a logarithmic drop in the bandwidth as the frequency becomes lower. The low-pass filter causes the data to only occupy the lower half of the frequency spectrum, and we take advantage of this by cutting the sampling rate in half. Then the same high and low pass filters can be applied to the data again.
It would seem that since it is not possible to create an ideal high pass or low pass filter, that this technique will always throw out some important data. However, if the high and low pass filters are exactly complementary, the theory is that this process will provide the original signal when the equalizer weightings are at 1.
If this is the case, then this technique should provide a completely flat frequency response graph when there are flat equalization levels--and the output will merely be a time-delayed version of the input. There also are not resolution-limiting problems seen in the low frequency (narrow-width) bands from the other techniques, since the same size filter is being used to produce each band.
This method is somewhat more complicated than the others. Yet depending on the order of the filters used it could represent a drastic increase in equalizer quality.
Implementation of the Downsampling Equalizer
In order to code the block diagram as an actual program, we need to clearly define what the ↓2 and ↑N boxes are doing. Though we theoretically only need half of the samples to represent the information once it has been low-pass filtered, this cannot be suitably accomplished in this algorithm by throwing away every other sample and then restoring samples through a hold function. Full interpolation would be required to restore the missing samples.
Instead of using interpolation, I used an alternate method to to downsample, filter, and then upsample again. Two levels of recursion are shown, and the time domain representations of each graphic equalizer band are shown as the partial results (band 1 and band 2). If this procedure is applied, then these arrays merely need to be weighted and then added together to produce the output signal:
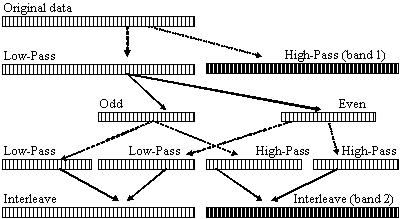
It may appear that a lot of calculation is being performed to produce these equalization bands. However, the parallelism and logarithmic decrease of the array widths being operated upon makes it so that each level really only corresponds to the application of a low pass and a high pass filter to an array the size of the original data. Also, the "odd/even split" steps and the "interleave" steps can actually done in-place--and require no processing time.
The "lowpass" and "highpass" functions were performed by convolving the data with a linear phase filter created using the Remez Algorithm. The filter was specified in two bands--one from 0 to 0.45 and the other from 0.55 to 1.0. The bands were set at values of 0 and 1, appropriate to whether it was high or low pass.
UPDATE 14-Oct-2008 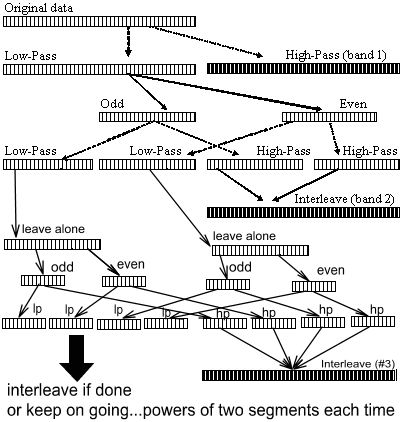
A visitor who found this site on a search engine tried to reproduce it for a project, and asked me to break it down a bit further. I warned him that this is old stuff from undergraduate EE that I am extremely rusty on. Still I hacked up the "next step" depicting how it would look with more than 3 bands in your EQ. Given how annoying the diagram becomes to draw at that point, it's unsurprising that I dodged more than 2 steps in the original paper. :)
So imagine that if you have a low pass Remez filter that basically passes everything below 2kHz, and you want to pass everything below 1kHz instead. To get an equivalent to a low pass 1kHz Remez filter, just use the 2kHz design on the even samples, the odd samples, and then interleave them back together in time. (Imagine a 4kHz Remez filter and dropping it to 1kHz by taking every 1st, 2nd, 3rd, and 4th sample... running the process... and then putting the samples back in their sequence post-filtering.)
This process is what I'm referring to as a "logarithmic drop". I have no clear certainty at this point in time of how to prove what I did gives you another "perfect reconstruction". Yet according to the commenter, he got it to work and it tested correctly. If anyone else happens across this and wants to throw in observations, please feel free.
The frequency response of this equalizer could not be directly calculated, so it was performed by measuring the response to a unit impulse. Applying a "midrange boost" ([1 2 3 2 1]) forms a very good response using length 32 lowpass and highpass filters, and has a respectable response even with length 16 filters.
Applying the algorithm using a level set of equalization values was the true test of whether or not it held up to one of the few tangible criteria for a graphic equalizer, and the results were encouraging. Despite several levels of data operations (5 applied levels of recursion) the response was perfectly flat for filters of length 32 and 16.
Investigations into the limits of the equalizer show that it performs quite well with almost any number of bands, and the bass bands do not degrade terribly even though they become quite narrow. A truly fair comparison of this technique with other possible methods would involve a detailed measure of the number of operations required as well as psycho-acoustics, but this filter nevertheless performs remarkably well.
Postscript: Why is it called a "graphic equalizer"?
Looking at the arrangement of sliders you can see kind of a "graph", whose X-axis is the frequency you want to modify and whose Y-axis is whether you are amplifying that range or cutting it out. This is how it gets the name "graphic equalizer". Because of that troublesome word "graphic", while researching for this article I found that a lot of people confuse this with the dancing animated bars while you play music. Those are called spectrum analyzers, and if you're geeky you can buy a shirt with one on it:
Spectrum analyzers are related to graphic equalizers, because they show you what frequencies are currently playing in your music. Bars closer to the left represent how much bass is playing, and bars closer to the right correspond to the treble. So if you were playing a flute, you would expect to see the bars jump in the range that corresponds to the flute. However, a spectrum analyzer doesn't let you change how much flute you hear... it just displays it.
As a sidenote, many flash-animated spectrum analyzers are fake and have nothing to do with what music is playing. For instance, even when you're listening to dead silence in the Myspace music player, the bars will still hop along. This kind of thing upsets me because it complicates technical education by showing people random nonsense to seem advanced.